
Vistra (VST) Valuation Check After Transformative Meta Nuclear Power Agreements
Vistra (VST) has moved back into focus after signing 20-year power purchase agreements to supply more than 2,600 MW of zero-carbon nuclear energy in support of Meta’s data center operations.
See our latest analysis for Vistra.
At a share price of US$160.02, Vistra has seen a 2.05% 1 day share price gain after the Meta nuclear deal. Its 90 day share price return of a 16.38% decline contrasts with a very large 3 year total shareholder return of about 7x. This indicates that long term momentum remains strong, even as recent volatility suggests investors are reassessing growth potential and financing risks linked to new bond issuance and acquisitions.
If deals like Vistra’s Meta agreement have you thinking about where electricity hungry data centers could turn next, it might be worth scanning high growth tech and AI stocks for other power hungry growth stories.
With Vistra trading at US$160.02 and data center demand in the spotlight, current metrics hint at a large implied discount to some analyst views. Is this a genuine mispricing, or is future growth already fully reflected?
Price-to-Earnings of 56.5x: Is it justified?
At US$160.02, Vistra is trading on a P/E of 56.5x, which is high compared with both its peers and the wider renewable energy industry.
The P/E multiple tells you how much investors are currently paying for each dollar of earnings, and it is a common way to compare valuation across utilities and power producers. A higher P/E often reflects expectations of stronger profit growth or a business mix that investors view as more attractive.
For Vistra, forecasts point to earnings growth of 24.9% per year, which is faster than the expected US market earnings growth of 16.1% per year and described as significant in its own right. That kind of projected profit growth helps explain why the market may be willing to accept a richer multiple, even as recent profit margins have compressed from 11.4% to 5.6% and interest coverage is flagged as weak.
The comparison to peers, though, is stark. Vistra’s 56.5x P/E is described as expensive versus the global renewable energy industry average of 17.1x and also expensive compared with its peer group average of 30.6x. It is also above an estimated fair P/E ratio of 41.6x, a level that the market could move toward if sentiment or growth expectations cool from current levels.
Explore the SWS fair ratio for Vistra
Result: Price-to-Earnings of 56.5x (OVERVALUED)
However, the rich 56.5x P/E and recent 90 day share price decline of 16.38% highlight sensitivity to changing growth assumptions and to any setbacks on large contracts.
Find out about the key risks to this Vistra narrative.
Another View: What Our DCF Model Says
While the 56.5x P/E suggests Vistra is richly priced, our DCF model points in the opposite direction. At US$160.02, the shares are trading about 54.9% below an estimated future cash flow value of US$354.98. This frames the recent weakness as a possible long term opportunity rather than a warning signal. Which story do you think fits better with your expectations for Vistra’s cash generation?
Look into how the SWS DCF model arrives at its fair value.
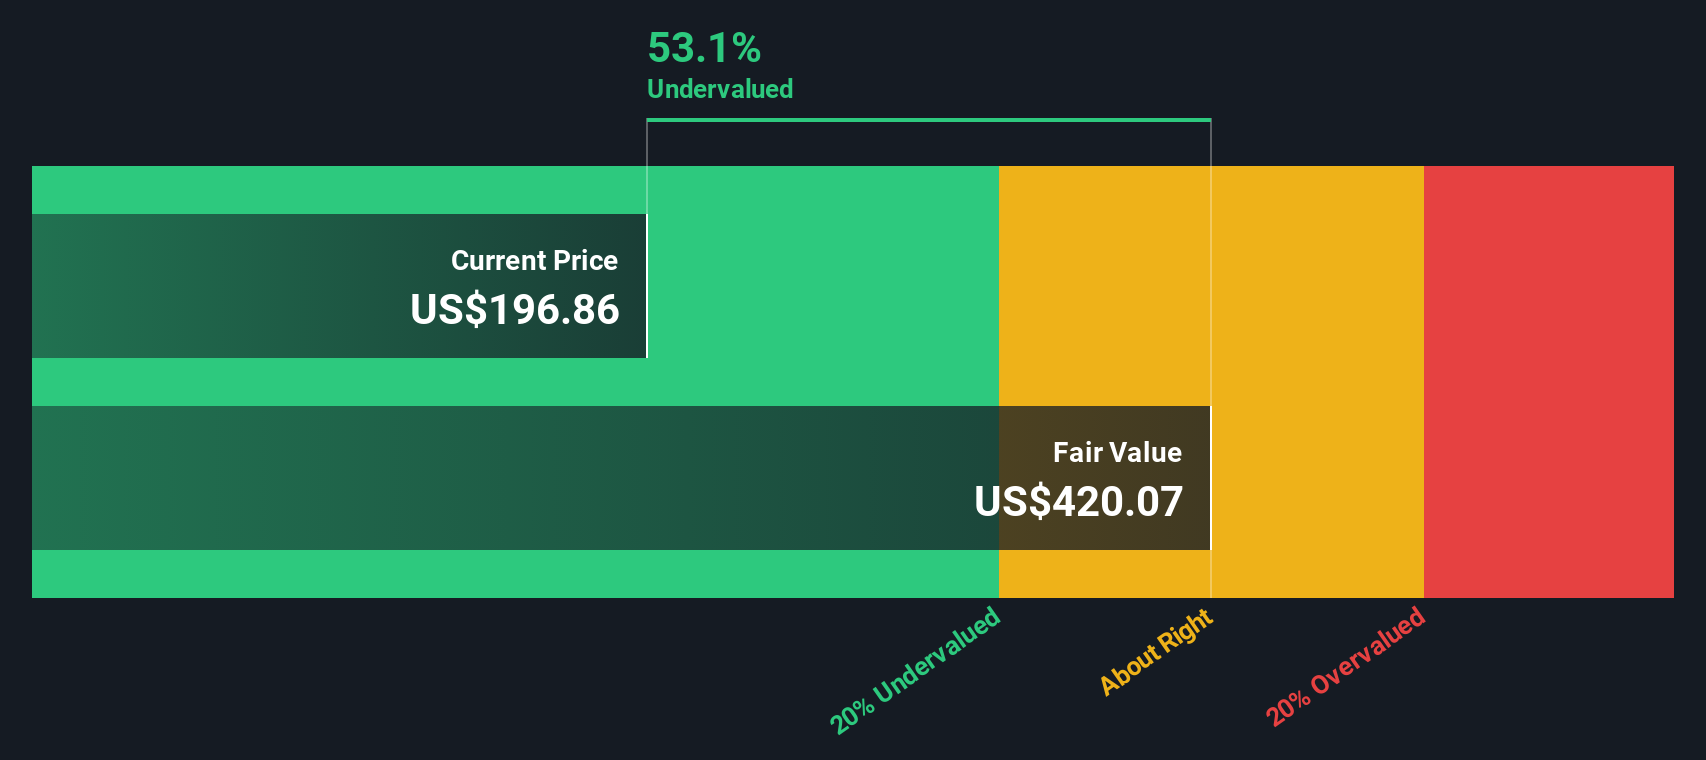
Simply Wall St performs a discounted cash flow (DCF) on every stock in the world every day (check out Vistra for example). We show the entire calculation in full. You can track the result in your watchlist or portfolio and be alerted when this changes, or use our stock screener to discover 881 undervalued stocks based on their cash flows. If you save a screener we even alert you when new companies match — so you never miss a potential opportunity.
Build Your Own Vistra Narrative
If you see the numbers differently or want to stress test your own view, you can build a customised Vistra story in just a few minutes by starting with Do it your way.
A great starting point for your Vistra research is our analysis highlighting 2 key rewards and 3 important warning signs that could impact your investment decision.
Looking for more investment ideas?
If you stop with just one company, you might miss some of the most interesting setups on the platform, so keep turning over stones and compare what you find.
This article by Simply Wall St is general in nature. We provide commentary based on historical data and analyst forecasts only using an unbiased methodology and our articles are not intended to be financial advice. It does not constitute a recommendation to buy or sell any stock, and does not take account of your objectives, or your financial situation. We aim to bring you long-term focused analysis driven by fundamental data. Note that our analysis may not factor in the latest price-sensitive company announcements or qualitative material. Simply Wall St has no position in any stocks mentioned.
New: Manage All Your Stock Portfolios in One Place
We’ve created the ultimate portfolio companion for stock investors, and it’s free.
• Connect an unlimited number of Portfolios and see your total in one currency
• Be alerted to new Warning Signs or Risks via email or mobile
• Track the Fair Value of your stocks
Have feedback on this article? Concerned about the content? Get in touch with us directly. Alternatively, email editorial-team@simplywallst.com