News
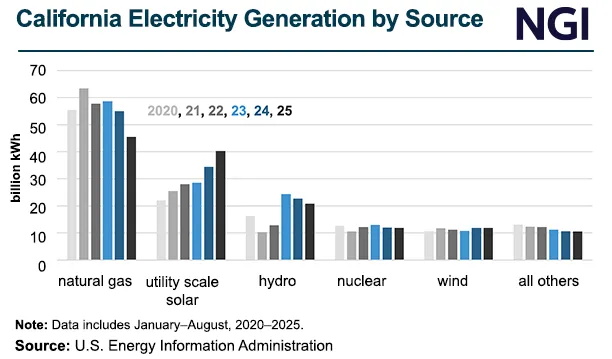
Even as Prices Shrink, Natural Gas Losing California Market Share to Solar
Key insights on the natural gas market provided by NGI’s price and data analysts
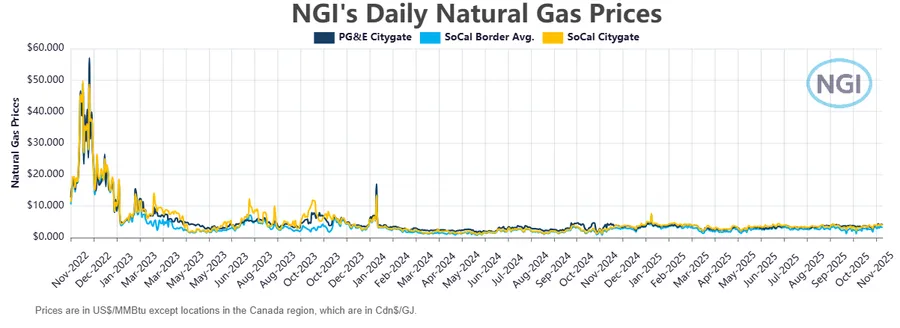
- Natural gas pricing in the historically volatile California market has been relatively subdued of late, as grid-scale solar energy and batteries have gained market share in the power sector. SoCal Border Avg. prices are averaging around $2.93/MMBtu in November, while both PG&E Citygate and SoCal Citygate are averaging around $3.75. At this time in 2022, prices were well in the double digits and even closed out the year with a high of about $49.00 for the SoCal Border Avg., $50.00 at the SoCal Citygate and $57.00 at the PG&E Citygate.