News

Daily Natural Gas Trades Overtook Bidweek in 2024 as SoCal Markets Drive Growth, NGI Analysis Shows

Natural Gas Intelligence · last updated

Key insights on the natural gas market provided by NGI’s price and data analysts
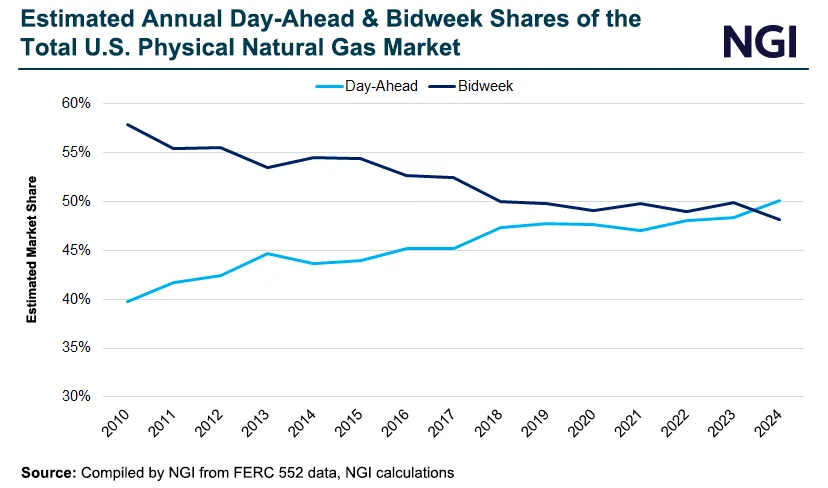
Line chart showing estimated annual market share of Day-Ahead and Bidweek transactions in the U.S. physical natural gas market from 2010 to 2024, based on FERC 552 data and NGI analysis. The chart illustrates a long-term decline in Bidweek share and a steady rise in Day-Ahead share, with Day-Ahead surpassing Bidweek for the first time in 2024.
  • Daily volumes surpass those from bidweek: For the first time since the advent of FERC 552 data in 2009, total U.S. trading volumes transacted in the daily market in 2024 eclipsed those in the bidweek market, according to a detailed analysis by NGI of the Federal Energy Regulatory Commission data through June 10. Total U.S. daily volumes reached 83,299 Tbtus compared to 80,133 Tbtus in the bidweek volumes.
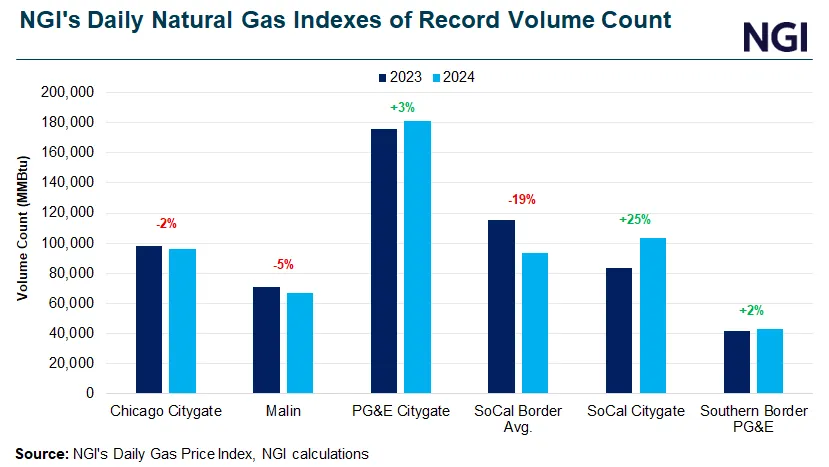
Bar chart comparing 2023 and 2024 volume counts (in MMBtu) for NGI’s Daily Natural Gas Indexes of Record at six key U.S. hubs: Chicago Citygate, Malin, PG&E Citygate, SoCal Border Avg., SoCal Citygate, and Southern Border PG&E. The chart highlights year-over-year percentage changes, including a 25% increase at SoCal Citygate and a 19% decrease at SoCal Border Avg., based on NGI Daily Gas Price Index data.